I constantly run into memory issues so that I have to force quit applications and restart Omnigraffle (7.2.2). Take this as example which just happened with a very small file (5 Pages, couple of wireframes without any images etc.). Please take a look at screenshot here: http://i.imgur.com/X4PmTVh.jpg
do you use a lot of stencils? i have the same problem.
I’ve reduced the amount of stencils to a minimum because I had the same thought. But even with very few stencils I keep running into this issue. What I also noticed is, that this mostly happens on documents which were previously designed in Omni 6.X. Maybe there is a problem between the two versions as well…
Sorry for this memory issue! If we can figure out what triggers it, that will make it much easier to fix.
I’ll ask our testing team to hunt for this, but have any of you noticed any pattern to when this happens? Does this always happen with that particular file? Or always after using a particular part of the interface (like the stencils window or resource browser) or performing a particular sequence of steps (like creating a new artboard or canvas)?
If we can find a set of steps that reproduces this behavior on demand, that would be ideal. (If it’s as simple as opening a particular document, hopefully we can find a way to look at what it is about that document that is triggering this.)
In my case its definitly a problem with stencils coming from an omnigraffle 6 file. (edit omnigraffle 5!)
I singled out all stencils and deleted them and you feel a speedboost with every 10 stencils you delete.
now my file is stencil free and the file is usable again.
if I now add the same stencils in omnigraffle 7, the file doesnt get slower again.
my personal problem is that this is not fixing my situation because I have to work with this file as it is…
edit: btw, the only stencils I use are material design icons, and sometimes some cursors.
edit2: i’m sorry… i now downloaded omnigraffle 6 and its slow too… my file wastn fast until i tried it with omnigraffle 5.4.4.
I cannot find an exact action which causes the issue. I have my “Activity Monitor” open while I work with the file and I check the memory usage from time to time. All I can see is that the Memory/Compressed Memory drastically increases over a longer period of time (20-30 minutes I reach the 30GB mark and continuing).
Where can I send the work file to? I don’t want to display it public here.
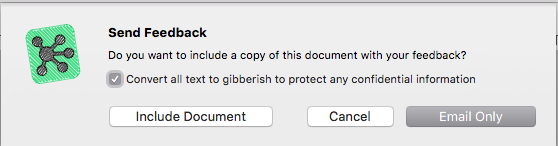
@forsty You are always welcome to email omnigraffle@omnigroup.com. If you do so from the Help menu of OmniGraffle, you’ll also get the option to include the front document you have open. OmniGraffle can even replace the text with gibberish, if that helps you feel more comfortable sharing your file with us. (It’s unlikely that the exact words in your document are causing the large memory leak.) If you could also describe the kinds of changes you make most, that might help us pinpoint the issue more quickly.
Thanks, I’ve just send you guys the file via Mail. I’ve used a different mail address so I hope that doesn’t lead to confusion. Hope you find something and can keep me updated here.
For anyone willing to try a test build, we believe we have addressed the memory issues in OmniGraffle 7.3. You can download a test build here: https://omnistaging.omnigroup.com/omnigraffle/
Let us know if this helps!
Dan
So far so good, the app runs stable at around 300MB memory usage so far after a couple of hours.
will test!
updated to 7.3 from app store and looking smooth right now!
will report when problems occur, but looking good
1 Like
