I am interested in the possibility of programmatically distributing midpoints of connectors like we do with objects. Basically what this post is about, but with a solution based on scripting rather than a grid (which doesn’t work in the generic case anyway).
The question is whether midpoints are selectable as objects to be distributed. I have an ancient version of OG (5.4.4), so I can only Copy as AppleScript, but this is more a question of object structure than of language.
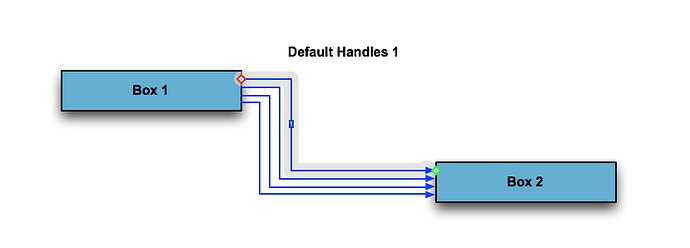
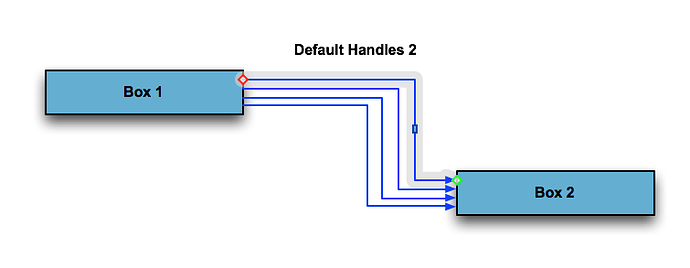
These 4 connectors have only the default handles that are automatically generated when a connector is connected. But whether they’re here:
or here:
they Copy as AppleScript identically:
	make new line at end of graphics with properties {point list: {{175.9608, 481.73}, {293, 536.7249}}, line type: orthogonal, stroke color: {0.000000, 0.000000, 1.000000}, head type: "FilledArrow", head scale: 0.5}
	make new line at end of graphics with properties {point list: {{175.9608, 476.8676}, {293, 531.8624}}, line type: orthogonal, stroke color: {0.000000, 0.000000, 1.000000}, head type: "FilledArrow", head scale: 0.5}
	make new line at end of graphics with properties {point list: {{175.9608, 491.455}, {293, 546.4498}}, line type: orthogonal, stroke color: {0.000000, 0.000000, 1.000000}, head type: "FilledArrow", head scale: 0.5}
	make new line at end of graphics with properties {point list: {{175.9608, 486.5925}, {293, 541.5873}}, line type: orthogonal, stroke color: {0.000000, 0.000000, 1.000000}, head type: "FilledArrow", head scale: 0.5}
The location of the default handle doesn’t appear to get saved.
Is this true in the latest OG via Save As Javascript?
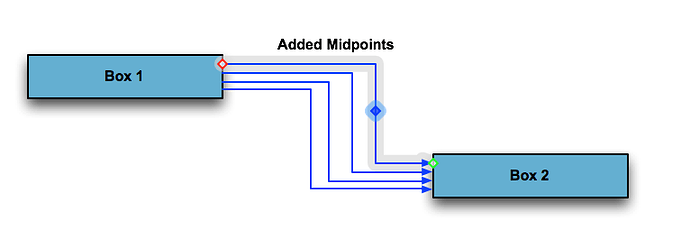
If I double-click to add Midpoints, like this:
then those get copied as discrete points:
	make new line at end of graphics with properties {point list: {{175.9608, 481.73}, {248, 503}, {293, 536.7249}}, line type: orthogonal, stroke color: {0.000000, 0.000000, 1.000000}, head type: "FilledArrow", head scale: 0.5}
	make new line at end of graphics with properties {point list: {{175.9608, 476.8676}, {261, 503}, {293, 531.8624}}, line type: orthogonal, stroke color: {0.000000, 0.000000, 1.000000}, head type: "FilledArrow", head scale: 0.5}
	make new line at end of graphics with properties {point list: {{175.9608, 491.455}, {225, 519}, {293, 546.4498}}, line type: orthogonal, stroke color: {0.000000, 0.000000, 1.000000}, head type: "FilledArrow", head scale: 0.5}
	make new line at end of graphics with properties {point list: {{175.9608, 486.5925}, {235, 514}, {293, 541.5873}}, line type: orthogonal, stroke color: {0.000000, 0.000000, 1.000000}, head type: "FilledArrow", head scale: 0.5}
It seems like that would be a fairly straightforward programming exercise to distribute evenly the X or Y positions of each non-terminal point.


